
If you’ve updated a price chart more than once in this year alone at 2 a.m., you are in good company. Bitcoin is currently approximately 50% off the October 2025 record high, and the issue many people are thinking about that’s likely on everyone’s mind right now: when will this turn?
There is no simple answer to that. When someone can tell you a precise date, they are guessing and when they sound 100% sure, they are probably selling you a newsletter, a signals service, or a course. However, “nobody knows” isn’t a very satisfactory answer and it’s not quite accurate. This is no different than the historical precedent, where on-chain data has been quite consistent with previous bottoms, macro conditions have had a well-documented correlation to crypto prices, and a really broad consensus of professional opinions that collectively convey a message about the fact that this is not settled.
It’s not a “hype” story, it’s not a “doom” story. An effort to explain, as clearly as possible, where the market is, how it came there, what has happened in the past to lead to a real recovery, and what serious forces are on both sides of the debate watching now. At the end, you will not have a date. You’ll have a structure and in an environment this turbulent, that will be worth much more.
The Crypto Market: Where It’s at Now
Firstly, numbers, since all of the worry when it comes to this is linked with not knowing what is going on.
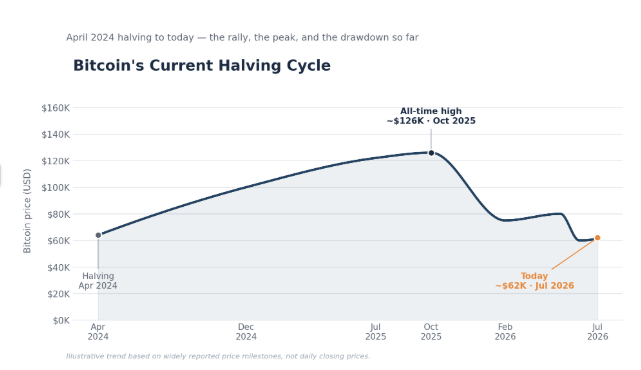
Bitcoin is currently priced in the low-to-mid $60,000s as of early July 2026, a move that had the cryptocurrency briefly drop below $60,000 in June for the first time since 2024. This is from an all-time high of over $126,000 in October 2025, a drop of nearly 50%. The wider market has followed suit and overall crypto market capitalization is around $2.1-$2.2 trillion, with Bitcoin making up around $1.2 trillion of that.
It’s been a pretty tough run by crypto’s standards. Bitcoin settled this first quarter of 2026 with a drop of roughly 22% from its previous levels, marking the worst first quarter since 2018. The second quarter recorded a further drop of about 13%, which brings the year’s drop down to just under 30% from the opening price in January at around $87,500. It’s only the third time in Bitcoin’s trading history that it’s started with two losing quarters.
Ether is worse off, having lost about 25% during the same period and regaining a significant portion of those losses, even though the majority of the gains from the launch of spot Ethereum ETFs have been taken by Bitcoin. Bitcoin has followed most large-cap tokens in terms of their movement, some of them very deep underwater.
Not surprisingly, sentiment has moved lower as a result of price declines. The combined indicator, known as Crypto Fear & Greed Index, which is based on volatility, trading momentum, social media sentiment, options positioning and Bitcoin’s dominance of the overall market capitalization, has been hovering around 15, signaling the Extreme Fear zone. Readings like this are not the middle of a downtrend; historically, it’s closer to the end of the downtrend. But closer to exhaustion and the bottom are not synonymous, and we shouldn’t gloss over the differences between the two.
None of this happened because of one bad headline. It’s the result of multiple pressures converging at once and knowing what those pressures are is the first true step to understanding what would need to shift for the market to pivot.
Crypto Is Down: What’s the True Reason for This Decline?
The easiest and most true answer is that money got more expensive, and more expensive money is less favorable to risk assets, and few assets have as much risk premium as crypto, traditionally speaking.
Late in 2025, the Federal Reserve lowered the federal funds rate from its earlier level and set it to range between 3.5% and 3.75%. Since then, there has been a significant change. Powell stepped down as chair in May of 2026 and his successor, Kevin Warsh, came into the role with the hottest inflation reading in three years. Consumer prices jumped 4.2% in May 2026, largely because of a price shock in energy caused by the conflict with Iran. At his inaugural policy meeting in June, Warsh’s Fed not only kept rates unchanged for the fourth straight meeting, but he also eliminated language that hinted at a rate cut and replaced it with a “dot plot” that highlighted that more officials than ever before are anticipating a rate increase before the year-end. That was a significant price change for a market that had been pricing in easier money and dollar liquidity always had a long history of impacting crypto prices. When money is tight, any type of risk asset becomes less appealing, but it can be even more so for the most speculative of them, and crypto is still at the forefront for most institutional allocators.
The rate story comes on top of a very real market demand/supply issue in the ETF space. Since their 2024 launch, Bitcoin ETFs have emerged as the predominant marginal buyer of BTC, choking off new BTC supply and providing a level path for crypto to enter traditional brokerage and retirement accounts. That reversed hard in 2026. According to SoSoValue data, U.S. spot Bitcoin ETFs experienced a net redemption of approximately $4 billion over the entire month of June, which was the highest monthly redemption since the funds were launched. The psychological effect is not the only one when the cars that are taking coin out of the market begin to give it back.
Then there’s deleveraging. A pullback is not only driven by cautious sales, but also when a market has been heavily leveraged (on borrowed money) with futures positions on margin and yield-bearing products. It characterizes the phenomenon of forced selling, which is when a price drop leads to liquidating and forcing further sell-offs, which in turn pushes down prices again and so on. That’s exacerbated by thin order books, too: when there aren’t as many buyers standing there as there ought to be, a large sell-off can cause the price to drop deeper than it appears merited.
Then there’s been the real rotation story in addition to all this. A fair amount of speculative funds were diverted from cryptocurrencies in 2026 and invested in stocks of AI and semiconductors and various IPOs in anticipation of the SpaceX offering, namely. The dollar’s strength also took some of the shine off Bitcoin’s dollar-stabilizing claims. Others, even those with a longer-term perspective, also suggest that the growth in global money supply is a more durable influence on crypto cycles, noting that these cycles tend to follow expansions and contractions in global liquidity, but in a lagged manner, of a few months.
What isn’t on this list? There has been no stablecoin collapse, no exchange or lender going belly up, no fraud becoming public. It’s not something to take lightly and it is something to consider because it affects the way you think of what a recovery may be.
This Bear Market Isn’t 2022, And That Distinction Matters
When the drawdown reaches 50%, it can be easy to think that you’re reliving 2022. The two scenarios rhyme, but they have been constructed quite differently and that difference is important to the way one should consider what will happen next.
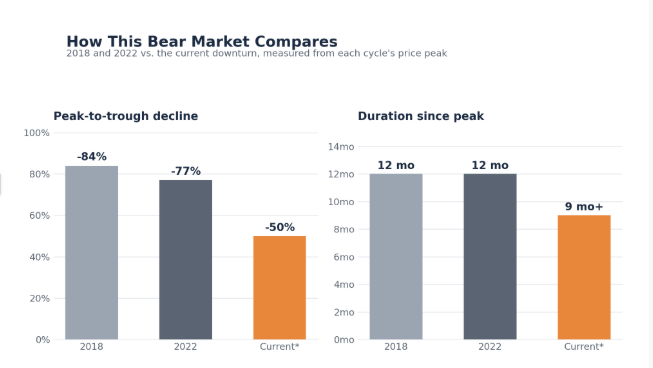
This bear market of 2022 began with a domino effect of collapses. That same May, the Terra/LUNA stablecoin collapsed, destroying tens of billions of dollars and ultimately leading to the demise of the Three Arrows Capital hedge fund, which in turn caused Celsius Network, a lending protocol, to collapse. The year ended with FTX, one of the biggest platforms in the space then, falling apart in November. Every time they got blown up, trust in the next institution eroded and it was a long time until the trust in the industry’s plumbing was restored. Over the same period, Bitcoin’s price dropped from approximately $69,000 to approximately $15,500, a decrease of approximately 77%. Like the crypto winter of 2018, which saw the collapse of the ICO boom and a surge of projects with little to no substance behind them, crypto winter has taken Bitcoin from its close-to- $19,000 valuation to under $3,300, a drop of 84%.
This downturn is not a typical one to look at under the hood. It’s been pushed by macro pressure and positioning, Fed policy, dollar strength, ETF flows and leverage unwinding, not by any single institution going under or any fraud being exposed. The company, known as MicroStrategy and by far the biggest corporate holder of Bitcoin, with over 580,000 BTC on its books, has seen its stock drop by over 45% this year, and in late June approved a plan to sell a portion of its holdings to finance dividends and share buybacks, the first sale of Bitcoin by the company since 2022. That is a sign of stress, it’s important for sentiment, but it’s a company that’s under stress to its balance sheet and not a Lehman-style failure that’s bringing everything down that’s connected to it. The same is true about strategy, which was the biggest net buyer of bitcoins for a lot of the past two years, and in early 2018, the company started selling them, removing a significant source of demand from the market, not quite a collapse, but a real problem.
Fortune said that an organic deleveraging, and not a structural crisis, is what a Wintermute strategist told them now, and that’s about as true as it’s been throughout the year. The difference is important because contagion-induced bear markets and macro-induced bear markets have different time horizons. A plumbing crisis takes years to overcome: a new set of counterparties, a new regulatory confidence, a new infrastructure: it took the plumbing industry years to rebound from 2022. A macro-driven drawdown, on the other hand, will typically reverse when the macro picture changes, as when rates resume their rise and when liquidity tightens and when the flows that had been bearing out begin to return in. It’s a distinction that is real, but not exact, and that’s why many analysts have been prepared to label this cycle as a painful but not “existential” one for the asset class.
However, there are two distinct statements, not existential and definitely near the bottom, and the depth of a drawdown isn’t the only metric that matters here. This is as much because duration matters, and on that point, this cycle has been, quite uncharacteristically, unusual.
Bitcoin Cycle: Why Crypto Moves in Waves
In order to begin grasping where Bitcoin could go next, it is important to recognize how the cryptocurrency has historically behaved in substantially different multi-year waves as opposed to a wide-ranging stock index steadily moving upward.
The halving of bitcoins is the most popular explanation. The amount of rewards that miners are paid for adding new blocks to the network is halved every four years, starting at 50 BTC per block at the genesis, through 25, 12.5, and 6.25, to the current reward of 3.125 BTC per block after the latest halving in April 2024. The following one is scheduled for about 2028. While the halving is never a surprise to anyone watching, because the rate of supply is fixed and transparent, the reduction in supply to the market does typically come before substantial price rises by 1 year or more and has been followed by the price rise.
Over the past few cycles the bond between the halving and the rally, which follows it, and the subsequent painful correction and subsequent bottoming has been remarkably, if not perfectly, consistent a cycle that looks something like this: a halving, a quiet period of accumulation, a rally that culminates in a 12-18 month peak, a painful correction, a bottoming process, and then it starts over again. Adopting that method, the April 2024 halving would see a cycle peak in mid-to-late 2025, fitting the historical trend pretty much exactly, as Bitcoin did in October 2025, about 17.6 months after the halving. Under the conditions of the rest of the pattern, the post-peak bear phase (12-18 months long) would yield a cycle low in the back half of 2026, just about a year after the October peak.
But that’s an awful lot of “if,” and it’s not a bad idea to listen to the argument that the four-year cycle isn’t a good model anymore. The logic is this: Bitcoin was mostly retail speculation in an undercapitalized, volatile market in previous cycles and that’s why the halving is a supply shock that had a lot of influence on Bitcoin’s price. The demand for spot ETFs, corporate treasuries, and other institutional structures is much greater and far more macro-sensitive today. However, interest rates, dollar strength and the risk appetite of institutional allocators are probably more relevant these days than the halving math itself, which is why this market correction is closely correlated with the Fed policy change and not any crypto-native event.
The truthful answer is quite likely that both are true: the halving cycle hasn’t been abolished, it simply doesn’t work as it used to without having to rely on other cycles. It’s one input on top of a market that now has to deal with central bank policy, ETF fund flows and the same general risk-on / risk-off buying and selling cycles that drive stocks and bonds. Well, that’s a good way to think about timing questions, really. The playbook is still relevant, but you need to view it with the big picture in mind, not as the only thing you should look at.
How Long Do Crypto Bear Markets Actually Last?
When you look at Bitcoin’s history from a broader perspective, the bear markets (20% or more off a high) have appeared at regular intervals and have actually ended at the same length more often than they have started.
The initial crashes of Bitcoin had set the tone. After its first genuine speculative run, it fell about 94% in 2011, then suffered a long grinding down from around $1,150 to below $200 from late 2013 to early 2015, around the time that the Mt. Gox exchange collapsed, as the largest exchange in the industry. Bitcoin’s bear market of 2018 started when it reached its December 2017 peak of near $19,000, on the heels of the ICO bubble, and continued for about a year until it hit its bottom near $3,300 in December 2018, an 84% drawdown. The 2021-2022 cycle had a similar pattern to the prior cycle, with a high in November 2021 at $68,814 and a low in November 2022 at $15,440, which represents a decrease of approximately 77% over the course of a year. Of course, the COVID crash in March 2020 was a whole new ball game, a sharp, brutal but short crash that was recovered within the span of roughly a month as central banks worldwide began to pour money into the world through various measures.
There are no buckets for the current cycle. By the middle of 2026, the market had entered its downtrend, which was about 8-to-9 months in duration from the October 2025 chart high, compared to the 12 months that typically occur in 2018 and 2022. However, if you compare its performance to a different benchmark, it’s one of the longest bear markets in Bitcoin’s history: Crypstudio expert analysis shows that Bitcoin was in a bear market for 233 days straight by the end of June 2026, placing it in the fourth longest on record after the top of the year before. Meanwhile, the true drawdown, which is about 50% peak to trough, has been shallower than those seen in 2018 with an 84% drop or 2022 with a 77% drop, so that same analysis called this one of the longest and mildest bear markets that Bitcoin had experienced.
A long, grinding, relatively shallow decline is what they seem to be having, and that’s perhaps a sign of a market that’s grown up more. More institutional capital is there to provide a floor, and more is there that can get out in an orderly, gradual manner through ETF redemptions, rather than the type of one-time panic dumping that was seen in previous crashes. A less dramatic scenario than a crash-and-snap-back, but perhaps a better depiction of a bear market after a certain degree of maturity for an asset class.
There’s a little bit of an outlier to note for seasonality. Bitcoin has posted nine consecutive positive Julys since 2013, when it finished the month 8% higher, with a median increase of about 8%. Importantly, the two previous bear-market Julys, 2018 and 2022, both ended with powerful bounces, a 21% gain and a 17% gain, respectively, not enough to suggest that any single July is immune to a strong bounce, but enough to remind us that even as bad as bear markets get, they’re unlikely to move in a straight line down. Conversely, the two most miserable months of Bitcoin’s year in history have been August and September on average, so a June reversal to the upside could not be considered the beginning of a bull run.
The Signals That Have Marked Every Previous Bottom
But no one is quite able to spot a bottom in real time, so it is a better exercise to know which indicators have tended to appear in the past near bottoms, rather than as a crystal ball, but as a way to estimate how far this process may be.
One of the most monitored on-chain indicators at this moment is the proportion of Bitcoin suppliers with a profit vs. loss. An on-chain data firm found in early June 2026 that the amount of circulating Bitcoin at a loss surpassed the number at a gain, approximately 10.5 million BTC were underwater, compared to 9.8 million BTC that were in the green. This crossover has appeared at or close to every major bear market bottom in Bitcoin’s history, as it is a period where even the holders that are buying the asset for a long time are broadly in the red, meaning they have passed the point of no return for price-sensitive holders to sell their holdings. But the length of this is very different across cycles, for instance, it was about a year in 2015, about 6 months in 2019, closer to 1 month during the COVID crash, and around 6 months in 2022. Not an exact clock, but rather a real signal.
Another relative indicator is the Bitcoin realized price, which is the average price at which each Bitcoin in circulation has been bought and sold on-chain last. In all past major bear markets, Bitcoin has fallen below the realized price and this time it did as well, with the price also testing its long-term moving average 200-week line around $61,300, although there were some short exceptions around this time in 2026.
There are a couple of behavioural indicators to watch as well as price mechanics. The other price action vs. positioning when it becomes obvious that there is selling pressure on weaker volume, or that big wallets are starting to pile up on-chain while retail sentiment remains fearful, or ETFs start seeing redemptions, is a position split that has historically preceded turns, but it is a very poorly defined signal by itself and can be very hard to read in real time. Mining economics also play a role: In early 2026, the network hashrate dipped around 5.8% as miners with lower hashrates were forced to either exit or lower their mining difficulty, which in previous cycles has usually resulted in a downward adjustment of the mining difficulty of the network.
But then there’s the sentiment, which, when read the other way round, is the phrase Bitcoin bear market reportedly reached a five-year peak sometime in late 2025 to mid-2026, surpassing the peaks of the 2021 crash and the 2022 bear market. The search behavior is more characteristic of panic than market tops, so that’s one reason some analysts consider the Fear & Greed Index to be in the teens for extended periods of time to be a sign that a market is near the end of the downside, as it has recently been. All of these signals are non-specific and none of them is time-bound. But several of the more reliable ones were flashing in mid-2026, which is one of the reasons a number of analysts began talking about the second half of the year being the more likely time frame of a real low, and whether or not that occurs at what price they disagreed.
What Would Actually Have to Happen for Crypto to Turn Around
Signals indicate the areas where things may be at the moment, while catalysts indicate the areas that would have to change. Some of them are easily distinguishable as the ones that analysts everywhere revisit.
One of them is money policy. Bitcoin and crypto, in general, have been high-beta risk assets with special sensitivity to the cost and availability of money for the past several years. Any real pivot away from a hold with a hike bias towards rate cuts would take some of the pressure off prices that have been weighing on them since the beginning of the year. Much of that is dependent on how fast the prevailing episode of inflation, boosted by the energy price shock, ebbs. A dovish turn is unlikely to happen unless Warsh can provide clear evidence that the CPI readings are getting closer to the 2% target, and the market has priced that in.
The second is ETF and institutional flow data, which, as one of the most transparent, daily and directional real-time metrics of crypto sentiment, has become one of the most closely watched. The net $4 billion of outflows from U.S. spot Bitcoin ETFs in June 2026 was a direct drag on price, and once that starts to be a steady trend and not just a couple of good days, it will be one of the most obvious signals that institutional price takers are buying Bitcoin instead of selling it. But the early and tentative signs of that were in the first days of July, when the ETF complex saw a significant daily inflow after a ten-day period of redemptions, if one day is any indication, and total ETF net assets, which are around $74 billion, have not reached their highs.
The third is that of regulatory clarity, which may sound abstract, but it’s very real. The uncertainty has finally been mentioned as one of the reasons why institutional capital remains more cautious than it could be, while bills intended to clarify how digital assets fit into the definition of securities have been languishing in the U.S. legislative process, sometimes known as the Clarity Act. However, the regulatory environment is not all bad news: the SEC has been granting permission for new crypto ETF structures at a quicker pace than in the past, typically slimming down the time it takes to list ETFs from around 240 days down to 75, and analysts at Bitwise have estimated that the U.S. could see over 100 new crypto-related ETFs in 2026 alone, with more than 125 already pending approval. The belief that more is better does not necessarily imply more is needed, but it does make it easier for the capital to be exposed, or it has increased the number of publicly traded companies with crypto on their books as treasury assets beyond Strategy.
The fourth, and more structural, is the further inexorable workings through the halving cycle on the supply side. There’s even been a reduction in the number of new coins that are being put into circulation, and if demand doesn’t even begin to pick up, let alone increase, over time, that supply limitation will continue to kick in as it has, with a lag, following every previous halving.
None of these are “on”/“off” switches that turn on some day. It’s a combination of them all, not any one single cause, but when they all happen at the same time, when the inflation print is a bit less hawkish, when the Fed sounds a little less hawkish, when the ETF flows stabilize, when a piece of legislation passes, that’s when it’s really reaching the inflection point. That’s the reason it’s hard to date and that’s why this is a study that those with a vested interest in it can’t agree on the date.
Why the Experts Can’t Agree on a Number
Don’t spend an afternoon reading professional forecasts before leaving the house, otherwise, you will feel a little like this: not that the experts don’t see eye-to-eye at the edges, but that they appear to live in totally different worlds. That gap is itself informative.
To be conservative, however, a well-regarded voice this cycle, Markus Thielen of 10x Research has pointed out that Bitcoin might still bottom at $46,000 to $47,000, citing that the market’s largest net buyer, Strategy, has been on the sell side for awhile and that bottoms have historically occurred within 360 to 380 days from the cycle peak, which would mark his estimate for a bottom sometime in October 2026. Another influential independent analyst, Benjamin Cowen, has arrived at a similar outlook for October 2026 as his base case. Our research team has identified the first opportunity where a credible bottom could be possible in the third quarter of 2026. None of the three are really concerned about the potential demise of crypto, rather, they are concerned about the depth and timing of the low, which remains quite shallow.
Then you will have forecasts which seem to be completely different on the other side of the fence that relate to the same asset. Fundstrat’s Tom Lee has been keeping his year-end 2026 price target as high as $250,000. Bernstein has maintained a $150,000 target for 2026 and $200,000 for the next cycle peak in 2027, and sees that as the beginning of a supercycle of tokenization. Another expert research team has had an even more ambitious $500,000 goal in mind for 2028. Brad Garlinghouse, the CEO of Ripple, has made a public prediction that Bitcoin will reach $180,000 by the end of 2026. Researchers at other companies have suggested a range of $120,000 to $170,000 for the year, with a median estimate of around $110,000 suggested by researchers like Carol Alexander, PhD.
Why such widespread? Some are, of course, momentum-and-cycle-driven technical calls, and others are institutional-adoption theses that see the ongoing drawdown as a minor blip on a much longer-term and higher-expected-share trend. But, in part, it is because they all have some motivation to be bullish in public, whether you’re an executive at a crypto company or an asset manager with funds to sell or a firm that trades products like stocks. Partly because crypto is a relatively new asset class and there have only been a few certain full cycles in history, and that makes what a model based on “historical patterns” is statistically fraught by comparison to a century of equity market data.
There is a smaller, more consistently wrong camp that deserves a fair name, though: crypto naysayers, including economist Nouriel Roubini, have been predicting crypto’s downfall for the past decade or more, while it, at times with fits and starts, continued to rise for the long haul. But they have never done it well, so that’s a good consideration to put against any single prediction, bullish or bearish, that they’re right this time. Even those analysts who see the pain first don’t have apocalyptic framing. Instead, Peter Brandt has given a clear sense of the chances that such a profound pullback may be underway, and made the point that it’s a pattern that has historically led to a meaningful recovery, not a permanent loss.
The honest withdrawal is not the average of the forecasts and splitting the difference isn’t a real method for uncertainty. It is because the size of the spread, ranging from $46,000 to $250,000 in the same calendar year, is from people who are really studying this for a living and when they put any single forecast out there, in either direction, it is a mistake.
Bitcoin Dominance, Altcoins and the Altseason Question
The answer to the question of “when will crypto go back up?” is really the question about Bitcoin, and a lot of people who ask it ask about altcoins as well, for which the honest answer is a bit different.
Bitcoin’s share of the total market capitalization of the crypto industry has been in the 58-60% range for the majority of 2026, with dips occasionally dropping to 56% and then rising again. This is a historically high amount, and it’s significant because this cycle’s institutional capital is going into Bitcoin more than the overall altcoin market, as retail speculators did in 2017 and 2021. This has come to be known amongst some analysts as the ETF wall: funds added to crypto via regulated Bitcoin products simply stay within BTC instead of, say, flowing outwards.
Altcoin Season Index 2026, which indicates the current state of the top 100 cryptocurrencies relative to Bitcoin over a 90-day window, has remained in the 30s and 40s for most of the year, as opposed to a reading of 75, which is the threshold for an altcoin season. That translates into a cycle that has been narrow but narrative when it comes to capital rotation away from Bitcoin, as of now. Some areas, such as real-world-asset tokenization, decentralized physical infrastructure networks, and AI infrastructure, have received focused attention and performed well at times, while the median altcoin has had poor performance. By the spring of 2026, the total market cap of all memecoins had dropped from its December 2024 highs of over $150 billion to below $34 billion, with more than 40% of altcoins trading at or below their all-time lows at various times during 2026.
A 2021-like everything goes up altseason just might be more difficult this year: There are far more tokens offering up rotation capital than there were in 2017 or 2021, and that means any particular rally would be shallower and more spread out in a much wider asset universe. That isn’t to say there are no strong altcoin rallies, as in past cycles they have happened on a sector-by-sector basis, but a singular wide altseason signal may need to fire in a similar manner twice.
When Bitcoin does pull back, however, and starts its recovery, as history has shown, it tends to maintain the dominance of its rally until Bitcoin’s rally has begun to slow, as it were, a digestion phase in the market, before then it seems as though the capital finds its way to the alts. Rising dominance of Bitcoin relative to the total market cap number is not sufficient evidence of an altcoin recovery; it is more useful to watch when Ethereum and Solana start to grow in dominance against Bitcoin, rather than just the price moving up.
What This Actually Means If You’re Holding Right Now
None of this is an opinion on buying or selling or holding anything, it is a function of your time frame, how much of this money you can afford to have tied up or at risk and your overall financial situation. While there’s no better way to think about it than to think about it yourself, preferably with a financial advisor who is familiar with all your circumstances. However, a few facts from the history books are worth reflection, though you may not be inclined to do so.
The first one is that previous bear markets in Bitcoin have come to an end. That doesn’t mean the same applies to this one, as the history of the market teaches us, but over the past three years of 2014-15, 2018 and 2022, it was never long after the declines of similar or greater size before new highs were reached, sometimes years later. The asset class has proven to be resilient, having come through some drawdowns that were at the time routinely and confidently called terminal.
The second one is that it’s not a promising sign that trying to time a precise bottom is not working. Even the best analysts this year are not in consensus by tens of thousands of dollars and in some cases by more than a quarter. If experts who trade full-time on-chain flows and Fed policy cannot agree on a number, the odds of any single investor picking the exact low are not high, and having a plan based on the ability to do that is a very fragile plan by nature.
Part of the reason dollar-cost averaging, purchasing a set dollar amount every period, whether up or down, is one of the most popular methods recommended to investors who wish to get exposure during a bear market but are not adept at spotting the bottom. It does not ensure the ideal entry price, but it eliminates the psychologically devastating part of determining in real time whether or not today is the day, and it automatically adds more when prices are down and less when prices are up.
The third thing about which you should be honest is how you feel about the information. If you’re buying and selling based on the price because you are constantly checking the prices out of panic, or out of a sense of urgency, or out of a sense of urgency because you think you are in the middle of a trend, it may simply mean that your position is bigger relative to your actual risk tolerance and financial situation than it should be. Extreme Fear readings in the high teens, such as the market has been displaying for weeks, are in the aggregate because all of a lot of people are experiencing that feeling at the same time.
Lastly, it’s important to differentiate the question of Bitcoin in the medium term from the question of any individual altcoin you may have in your portfolio. The data indicates that institutional money has a significantly greater preference for exposure to the Bitcoin market at this moment than the overall market of alts, with over 40% of alts trading at or close to their all-time lows during 2026. When and if a recovery comes, it might not come as fast or as high as in 2017 or 2021.
The Honest Answer
Therefore, when will the crypto start to rise again?
The safest answer is probably sometime in the latter part of 2026 and 2027, if the halving-cycle theory is correct, and if the Fed’s current hawkish stance remains unchanged and softens its policy stance as inflation subsides. But that answer is based on two big “ifs” and there are a number of sophisticated analysts who keep a close eye on this market who are sitting ducks for a price drop before that. The signals to track are anything that is tangible, measurable, and verifiable: Is the ETF flow holding, or does it simply bounce back and forth for a few days and then resume its downward trend? Is the Fed’s tone moving from a hold with a hike-bias down to a cut-bias? Are Bitcoin’s on-chain metrics accurate and still displaying the same behavior they’ve shown in almost every bottom? Is sentiment starting to move from Extreme Fear, or does it simply show up for a few days and then roll back down?
This article or any other will not provide you with a reliable date. The diversity of professional forecasts, from a potential drop into the $40,000 range to year-end targets above $200,000, isn’t a sign of an inadequate analysis. It’s a fair indication of the fact that there’s plenty that is still unresolved: Fed policy that will likely shift either way; an inflation forecast tied to geopolitical risks, which are by their nature unpredictable; and an asset class that has only experienced a few inflation cycles so far.
What history does reliably teach is that crypto bear markets are long, crypto bear markets are painful, and all crypto bear markets have come to an end, at least at this point, typically when the vast majority of people had ceased to hope that they would. The turn rarely announces itself with a headline. It manifests often without making any loud headlines in the news or flow data or on-chain metrics, but shows up well in advance of that. If you are attempting to time this just right, the data indicates that you should put aside this thought altogether. If you are attempting to grasp it sufficiently to make an educated choice regarding your own circumstance, hopefully this has gotten you a long way to that.
